 English
 Español
 中文
中文 हिन्दी
 Français
Hong Kong
Xianggang
Declare Your Relationship to Hong Kong
CountryReports Community
- Studying0
- From Hong Kong0
- Hong Kong heritage0
- Visited0
- Want to visit0
Customs and Culture
Customs and Culture
About the People
Hong Kong is known as 'The Pearl of the Orient', due to its scenic beauty and the energy of its people in building a major trade center. Hong Kong Chinese people are influenced by the Confucian ethic, setting out proper family and social relations. The actions of an individual are seen to reflect on the family and society. 'Saving face' is an important element of social interaction. Most residents identify with Hong Kong first, then China.
Cultural Attributes
Hong Kong is known as 'The Pearl of the Orient', due to its scenic beauty and the energy of its people in building a major trade center. Hong Kong Chinese people are influenced by the Confucian ethic, setting out proper family and social relations. The actions of an individual are seen to reflect on the family and society. 'Saving face' is an important element of social interaction. Most residents identify with Hong Kong first, then China.

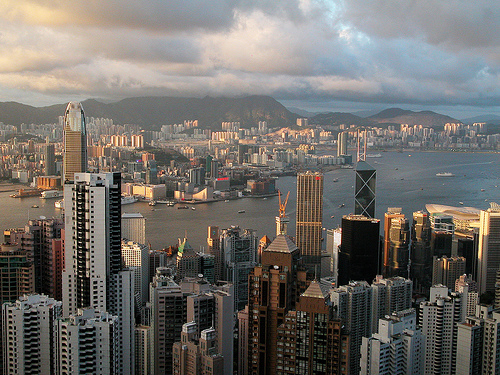
Harbor of a Thousand Voices, Skyline of Ambition
Greetings, Gestures & Visiting
It is common to see both Chinese and English forms of greeting in Hong Kong. Ethnic Chinese shake hands with non-Chinese. People politely inquire about the health of the family or the business affairs. Nicknames are used for friends or relatives. Otherwise, the Chinese address each other by full name or title. A Chinese family name comes first, followed by a given name. Many Hong Kong Chinese adopt a Western name. These names are often added before the family name, eg Johnny Leung Wai Po.
Though it is tradition to sit with hands in the lap and feet on the floor, many modern Hong Kong residents are more relaxed. Crossing legs can offend some people. Winking can be in bad taste and have bad connotations. To point, an open hand is best. Chinese beckon with the palm down and all fingers waving. It is impolite to touch a person's head, and to talk loudly. When talking with someone, be sure not to blink your eyes conspicuously, as this is a sign of disrespect and boredom.
To beckon someone in Hong Kong, extend your arm and place your palm downward. Make a scratching motion with your fingers. l Never use your index finger, with your palm up and toward you with your finger wagging towards you this gesture is only for animals.
To signal to a waiter in a restaurant that you would like your check, make a writing motion in the air with your hands.
Tea is often served during meetings. Do not drink your tea until your host begins. If the tea is untouched by your host for a long period of time, then this may signal that the meeting is finished.
Entertaining visitors is a popular activity in Hong Kong, though due to busy schedules and small homes, dining out in restaurants is common. When visiting a home, it is wise to call first, to ensure the resident is there. Visitors are treated with respect and attention. Food may be prepared specially and conversation tailored to their interests. On first-time visits, a consumable gift is appreciated. People offer and receive a gift with both hands. Sometimes, a final round of tea gives a signal the visit is coming to a close. It is polite to serve others first, with tea or food. The best portion of food goes to others, whether host or visitor.
Modesty and cleanliness is important in the public arena. Hong Kong residents wear a wide range of dress styles, though there is an emphasis on style. At home, casual clothing is worn.
Diet
Rice is the staple food. Most of the food in Hong Kong is imported. Fried rice usually includes a little pork, chicken, prawn and vegetables. Congee is a rice dish with the consistency of porridge. Several kinds of dim sum (dumplings) are popular. Oranges and melons are popular fruit for juicing. The wide variety of food available means a varied diet.
The use of chopsticks is prevalent in Chinese dining. Though Chinese like to share food with the family, work schedules make this difficult. Dishes of food are typically placed in the center of the table, and diners help themselves with chopsticks. Placing the rice bowl close to the mouth is proper. Talking too much is impolite at the table. The cosmopolitan nature of the Hong Kong cuisine means that people enjoy a wide range of food.
Rice is the staple food. Most of the food in Hong Kong is imported. Fried rice usually includes a little pork, chicken, prawn and vegetables. Congee is a rice dish with the consistency of porridge. Several kinds of dim sum (dumplings) are popular. Oranges and melons are popular fruit for juicing. The wide variety of food available means a varied diet.

Family
With one of the lowest divorce rates in the world, Chinese family loyalty and obedience is extremely strong. One child is the norm, and while the extended family is traditional, the nuclear family unit now prevails. Most people live in high-rise apartments. It is difficult to afford other types of housing. Women are still responsible for the household, although both men and women work outside the home. Professional couples often employ a live-in domestic help.
Dating Customs
Couples enjoy dining out, movies, picnics and shopping malls. Young people usually wait to marry till they can have their own apartment. Parents' approval of partner choice is important. All marriages must have a civil ceremony, and Christians also have a church wedding. A traditional wedding includes a large banquet for family and friends. Some arrive early to play mahjong. The bride wears a traditional red and gold Chinese wedding dress (cheongsam) but changes twice during the proceedings. The groom wears a Western suit.
Recreation
Hong Kong people do not participate in many sports and do not play them much as kids.
Holidays
National Day
10/1Independence
Anniversary of the Founding of the People's Republic of China), 1 July 1997 is celebrated as Hong Kong Special Administrative Region Establishment Day
Christmas
12/25Christmas
Hong Kong may be part of China, but the fact that it was, at one point, a part of the British Colony makes Christmas in Hong Kong a major holiday. A lot of shopping areas feature lights and decorations with snowmen, candy canes and the Nativity scene. Christmas music is featured in all the malls and the Nutcracker is played in theaters. Choirs can be found in malls and churches, singing traditional English Christmas songs.
Santa Clause or ‘Christmas Old Man’ is known in the Mandarin dialect as LanKhoong, pronounced ‘LanCoong’ or Dun CheLaorRen pronounced ‘Doon Shay Lar Wren’ and Sing Daan Lou Yan pronounced ‘Sing Dan Lou Yawn’ in Cantonese. Santa Claus with his eight reindeer in Hong Kong is a refreshing sight to see. The Far Eastern Christmas Scene in Hong Kong is mostly celebrated in Christian Homes, some with Christmas Trees.
Christians in Hong Kong celebrate Christmas with a church service in Chinese. The Anglican Cathedral features church services for Europeans who work in Hong Kong, and conduct services in English. There is a Midnight Mass, featuring Christmas carols sung in English and a Nativity performance. The choir singing Christmas Carols in church makes a wonderful backdrop for the Nativity.
Christmas is a time when Hong Kong Christians send each other Christmas cards. The cards are flamboyantly and exquisitely decorated. Christmas cards in Hong Kong consist of the Holy Family in a Chinese Setting. Poinsettias are everywhere during Christmas, decorating everything from homes to the church and shops. Public areas are also decorated, mostly with streamers and paper chains with large gold letters that say ‘Christmas’ in Chinese letters..
Annually, a Winterfest is held in Hong Kong and is a huge celebration involving theme parks, shops and other festivities. Winterfest is normally held on the last week of November to the fourth week of January and includes a gigantic Christmas tree in Statue Square, A glittering castle in Disneyland Hong Kong and a Christmas tree forest which features two hundred trees. An ice skating extravaganza at Ocean Park is also featured.
Aside from the giant Christmas tree, Winterfest is famous for its New Year’s countdown, lights and fireworks display all over Hong Kong. Each building and skyscraper is lit up to celebrate the end of one year and the beginning of the next.
On Christmas day, some families go together as a group to Kowloon Park where there is a Christmas party at every corner. A light show at Hong Kong Harbor is then featured at 8pm on Christmas Day.
<p>New Year's Day</p>
1/1Marks the start of the Gregorian calendar year; fireworks and celebrations in Victoria Harbour.
<p>Lunar New Year (Chinese New Year)</p>
<p>Traditional1st–3rd days of the 1st lunar month
The most important holiday of the year — family reunions, lai see (red packets), flower markets, lion dances, and a famous night parade and fireworks. Three public holiday days.
<p>Ching Ming Festival</p>
<p>Early April (15 days after spring equinox)</p>
"Tomb-Sweeping Day" — families visit ancestral graves to clean them and make offerings.
<p>Buddha's Birthday</p>
4/8Celebrates the birth of Siddhartha Gautama; devotees perform the "Bathing of the Buddha" ritual. Famous bun festival on Cheung Chau Island often falls near this time.
<p>Tuen Ng Festival (Dragon Boat Festival)</p>
5/5Commemorates the poet Qu Yuan — dragon boat races held across the territory and eating of rice dumplings (zongzi).
<p>HKSAR Establishment Day</p>
7/1Marks the 1997 handover of Hong Kong from Britain to China and the establishment of the Special Administrative Region.
<p>Mid-Autumn Festival (day after)</p>
8/15Families gather to admire the full moon, eat mooncakes, and light lanterns; the Tai Hang Fire Dragon Dance is a highlight. The public holiday is the day after the festival since celebrations run late into the night.
<p>National Day</p>
10/1Celebrates the founding of the People's Republic of China in 1949; flag-raising ceremonies and fireworks.
<p>Chung Yeung Festival</p>
9/9"Double Ninth" — like Ching Ming, families visit graves; many also hike to high places, a tradition believed to ward off misfortune.
<p>Boxing Day (first weekday after Christmas)</p>
12/26British colonial legacy; extends the Christmas holiday.
Dates of Interest
- December 25th
Hong Kong may be part of China, but the fact that it was, at one point, a part of the British Colony makes Christmas in Hong Kong a major holiday. A lot of shopping areas feature lights and decorations with snowmen, candy canes and the Nativity scene. Christmas music is featured in all the malls and the Nutcracker is played in theaters. Choirs can be found in malls and churches, singing traditional English Christmas songs. Santa Clause or ‘Christmas Old Man’ is known in the Mandarin dialect as LanKhoong, pronounced ‘LanCoong’ or Dun CheLaorRen pronounced ‘Doon Shay Lar Wren’ and Sing Daan Lou Yan pronounced ‘Sing Dan Lou Yawn’ in Cantonese. Santa Claus with his eight reindeer in Hong Kong is a refreshing sight to see. The Far Eastern Christmas Scene in Hong Kong is mostly celebrated in Christian Homes, some with Christmas Trees. Christians in Hong Kong celebrate Christmas with a church
How do people greet each other in Hong Kong?
Both Chinese and English forms of greeting are common, and ethnic Chinese shake hands with non-Chinese. People politely inquire about family health or business affairs.
Do
- Shake hands when greeting non-Chinese
- Politely ask about the family's health or business
- Address people by full name or title unless you're friends or relatives
Good to know
- A Chinese family name comes first, followed by the given name
- Many Hong Kong Chinese adopt a Western name, often placed before the family name (e.g., Johnny Leung Wai Po)
- Nicknames are reserved for friends and relatives
What are the dining customs in Hong Kong?
Rice is the staple and chopsticks are standard, with dishes placed in the center of the table for diners to share. Cuisine is cosmopolitan and varied.
Do
- Use chopsticks to help yourself from shared central dishes
- Hold the rice bowl close to your mouth
- Wait for your host before drinking your tea
- Serve others first and offer them the best portion of food
Don’t
- Don't talk too much at the table
- Don't drink your tea before your host begins
Good to know
- To signal a waiter for the check, make a writing motion in the air
- Untouched tea by your host for a long time may signal a meeting is over
- Popular foods include fried rice, congee, and dim sum
What etiquette should I know when visiting a home in Hong Kong?
Visitors are treated with respect and attention, though dining out is common due to busy schedules and small homes. 'Saving face' is an important element of social interaction.
Do
- Call first before visiting a home
- Bring a consumable gift on a first-time visit
- Offer and receive gifts with both hands
- Serve others first with tea or food
Good to know
- A final round of tea may signal the visit is coming to a close
- Individuals' actions reflect on their family and society
How should I dress in Hong Kong?
Modesty and cleanliness are important in public, and there is an emphasis on style. Casual clothing is worn at home.
Do
- Dress modestly and cleanly in public
- Pay attention to style
Which gestures are important in Hong Kong?
Several gestures carry meaning: use an open hand to point, beckon with the palm down, and avoid winking or touching someone's head.
Do
- Point with an open hand
- Beckon by extending your arm, palm down, and making a scratching motion with your fingers
Don’t
- Don't wink or blink conspicuously — it signals disrespect or boredom
- Don't touch a person's head
- Don't talk loudly
- Don't beckon with index finger and palm up — this is only for animals
Good to know
- Crossing legs can offend some people
- Sitting with hands in the lap and feet on the floor is traditional, though many are more relaxed
What is family life like in Hong Kong?
Chinese family loyalty and obedience are extremely strong, with one child the norm and the nuclear family now prevailing. Parents' approval of a partner is important.
Good to know
- Most people live in high-rise apartments
- Both men and women work outside the home, though women remain responsible for the household
- Young people usually wait to marry until they can have their own apartment
- Weddings include a civil ceremony and often a traditional banquet; the bride wears a red and gold cheongsam
What do people do for recreation in Hong Kong?
Hong Kong people do not participate in many sports and do not play them much as children. Couples enjoy dining out, movies, picnics, and shopping malls.
Good to know
- Popular leisure activities include dining out, movies, picnics, and shopping malls
Last updated: 2026-07-12 · Sources: CountryReports
Photos of Hong Kong
Photos of Hong Kong


Travel and Tourism
Travel and Tourism
- Travel Alert Status
- Level 3: Reconsider Travel
- Currency
- Hong Kong dollar (HKD)
- Climate
- The area's varied climate is governed by the monsoons. Although Hong Kong lies within the Tropics, it enjoys a variety of weather because of these seasonal winds. The winter monsoon blows from the north or northeast from September to mid-March, and the summer wind blows from the south or southwest from mid-March to September. During the summer monsoon, the weather is hot and humid; during the winter monsoon it is cool. Average temperatures range from 58°F in February (with lows in the 40's) to 82°F in July (with highs in the 90's.) The mean relative humidity ranges from a low of 67% in November to 84% in May; many days the humidity approaches 100%, accompanied by heavy clouds. Late fall is the most pleasant time of year, generally with dry and sunny weather and high temperatures of 70° to 75°F. The average annual rainfall is 95 inches.
- Airports
- 4
Read the full travel guide — health, safety, vaccinations, disease risk, sanitation, and transit details.
View full travel guideRecipes
Recipes
Braised Broad Beans
Side Dish
Main Dish
Braised Carp With Ginger
Main Dish
Grouper in Black Beans
Main Dish
Pan Fried Chicken with Lemon
Main Dish
Roast Pork
Main Dish
Char Siu Bao (Roast Pork Dumpling)
Main Dish
Scrambled Eggs with Shrimp
Main Dish
PremiumStir Fried Garoupa
Main Dish
PremiumSpring Rolls
Main Dish
PremiumStir Fried Shrimp with Assorted Vegetables
History
History
Historical Eras
Ancient & Pre-Colonial
3000 BCE – 1841
Human settlement in the Hong Kong region dates back over five millennia, with neolithic artifacts reflecting influence from northern Chinese stone-age cultures. Han Chinese settled the territory during the seventh century AD, and significant migration from northern China occurred during the Song Dynasty (960–1279). For centuries the area remained a modest coastal periphery of successive Chinese imperial dynasties, sustaining fishing and salt-production communities.
British Colonial Era
1841 – 1941
Following China's defeat in the First Opium War, Hong Kong Island was ceded to Britain under the 1842 Treaty of Nanking, establishing a permanent Crown Colony. The 1860 Convention of Beijing added the Kowloon Peninsula, and a 99-year lease of the New Territories in 1898 greatly expanded the colony's extent. Hong Kong rapidly grew into a vital warehousing, distribution, and trading hub linking British commerce with southern China.
Japanese Occupation
1941 – 1945
Japanese forces invaded and occupied Hong Kong in December 1941, bringing British colonial rule to an abrupt halt for nearly four years. The occupation was marked by severe hardship, food shortages, forced labor, and a dramatic reduction in the civilian population. Britain formally resumed sovereignty and re-established civil government in 1946 following Japan's surrender.
Post-War Growth
1945 – 1997
The communist victory in China's Civil War in 1949 drove hundreds of thousands of refugees into Hong Kong, providing a surge of labor that fueled rapid industrialization. Over subsequent decades the territory transformed from a manufacturing base into one of Asia's foremost financial, commercial, and tourism centers, achieving remarkable gains in life expectancy, literacy, and per capita income. Political tensions periodically surfaced, including Cultural Revolution-inspired riots in 1967, while the 1984 Sino-British Joint Declaration set the framework for the colony's return to China.
Handover & SAR
1997 – present
On 1 July 1997, sovereignty over Hong Kong was transferred to the People's Republic of China, establishing the Hong Kong Special Administrative Region governed under the "one country, two systems" principle enshrined in the Basic Law. China pledged to preserve Hong Kong's distinct legal, economic, and social frameworks for 50 years. The period has been defined by economic dynamism alongside recurring tensions over democratic freedoms, culminating in sweeping national-security legislation enacted in 2020 that significantly reshaped the territory's political landscape.
Overview
In the late 19th century and early 20th centuries, Hong Kong developed as a warehousing and distribution center for U.K. trade with southern China. After the end of World War II and the communist takeover of Mainland China in 1949, hundreds of thousands of people fled from China to Hong Kong. Hong Kong became an economic success and a manufacturing, commercial, finance, and tourism center. High life expectancy, literacy, per capita income, and other socioeconomic measures attest to Hong Kong’s achievements over the last five decades.
Timeline of Key Events
1600
Hong Kong was founded by British Naval officers.
Hong Kong, the name means fragrant harbor, was founded by British Naval officers in the 17th century as a western trading post for tea.
1839
The British captured Hong Kong from China.
The British captured Hong Kong from China.
1842
China cedes Hong Kong island to Britain after the First Opium War.
China cedes Hong Kong island to Britain after the First Opium War. Over the decades, thousands of Chinese migrants fleeing domestic upheavals settle in the colony.
1856 – 1858
The 2nd Anglo-Chinese Opium War.
The 2nd Anglo-Chinese Opium War.
1898
China leases the New Territories together with 235 islands to Britain for 99 years from 1 July.
China leases the New Territories together with 235 islands to Britain for 99 years from 1 July.
1941
Japanese troops occupied Hong Kong.
Japan occupies Hong Kong. Food shortages impel many residents to flee to mainland China. The population drops from 1.6m in 1941 to 650,000 by the end of the Second World War.
1946
Britain re-establishes civil government.
Britain re-establishes civil government. Hundreds of thousands of former residents return, to be joined over next few years by refugees fleeing the civil war between the Nationalists and the Communists in China.
Read the full history profile — narrative overview, defining eras, and the complete timeline in one place.
View expanded historyInteresting Facts
Interesting Facts
The emblem for the reunification of Hong Kong with China is Sousa Chinensis (the Chinese White Dolphin) which in fact is pink.
Hong Kong is very hilly and there are outdoor escalators in the Central district of the Island.
Hong Kong, the name means fragrant harbor, was founded by British Naval officers in the 17th century as a western trading post for tea.
Hong Kong is densely-populated. Its overall density: 6,420 people per sq km.
People eat long noodles on their birthday so they may have a long life.
During the Chinese New Year festivities, children are given “Lai see” (lucky money).
See every fact — trivia, oddities, and curious tidbits gathered from across the country.
View all interesting factsGeography and Environment
Geography and Environment
- Terrain
- hilly to mountainous with steep slopes; lowlands in north
- Climate
- The area's varied climate is governed by the monsoons. Although Hong Kong lies within the Tropics, it enjoys a variety of weather because of these seasonal winds. The winter monsoon blows from the north or northeast from September to mid-March, and the summer wind blows from the south or southwest from mid-March to September. During the summer monsoon, the weather is hot and humid; during the winter monsoon it is cool. Average temperatures range from 58° F in February (with lows in the 40's) to 82° F in July (with highs in the 90's.) The mean relative humidity ranges from a low of 67% in November to 84% in May; many days the humidity approaches 100%, accompanied by heavy clouds. Late fall is the most pleasant time of year, generally with dry and sunny weather and high temperatures of 70° to 75° F. The average annual rainfall is 95 inches.
- Natural Hazards
- occasional typhoons
- Current Environmental Issues
- air and water pollution from rapid urbanization
Read the full geography and environment profile — terrain, climate, natural resources, hazards, land use, and international agreements.
View full geographyPeople & Demographics
People & Demographics
Religion
Languages Spoken
Chinese (Cantonese), English; both are official
- Cantonese
- English
Population
- Population
- 7,089,705
- Nationality Noun
- Chinese/Hong Konger
- Ethnic Groups
- Chinese 95%, other 5%
- Language Note
- The official language of Hong Kong is Chinese. English is still the language of commerce, as it was the official language up until 1997. The official dialect is Yue (Cantonese) from Guangdong. Chinese written script has been standardized for centuries, but the simplified script from mainland China is beginning to become popular in Hong Kong.
Education
- Literacy Definition
- Age 15 and over has ever attended school
Read the full people and society profile — demographics, health, education, religion, languages, and notable people.
View full people and societyGovernment & Politics
Government & Politics
Country Identity
- Country Name
- HongKong
- Full Country Name
- Hong Kong Special Administrative Region
- Local - Long
- Xianggang Tebie Xingzhengqu
- Local - Short
- Xianggang
Government Structure
- Government Type
- limited democracy
- Legal System
- based on English common law
- Executive Branch
- chief of state: President of China XI Jinping (since 14 March 2013) head of government: Chief Executive John LEE Ka-chiu (since 1 July 2022) cabinet: Executive Council consists of 16 official members and 16 non-official members elections: Chief Executive Carrie LAM served from 1 July 2017 to 30 June 2022 after being selected by the 1,200-member Election Committee; John LEE was selected by the Election Committee on 8 May 2022 and formally took office on 1 July 2022; the Election Committee, dominated by pro-Beijing figures, was restructured under the 2021 electoral reforms to expand its role in selecting the Chief Executive; the next Chief Executive election is scheduled for 2027
- Legislative Branch
- unicameral Legislative Council or LEGCO (60 seats; in 2004 30 seats indirectly elected by functional constituencies, 30 elected by popular vote; members serve four-year terms) elections: last held 12 September 2004 (next to be held in September 2008) election results: percent of vote by party - pro-democracy group 62%; seats by party - (pro-Beijing 34) DAB 12, Liberal Party 10, independents 11, FTU 1; (pro-democracy 25) independents 11, Democratic Party 9, CTU 2, ADPL 1, Frontier Party 1, NWSC 1; non-voting LEGCO president 1
- Judicial Branch
- Court of Final Appeal in the Hong Kong Special Administrative Region
- Suffrage
- direct election 18 years of age; universal for permanent residents living in the territory of Hong Kong for the past seven years; indirect election limited to about 100,000 members of functional constituencies and an 800-member election committee drawn fr
- Constitution
- Basic Law approved in March 1990 by China's National People's Congress is Hong Kong's ""mini-constitution""
- Independence
- none (special administrative region of China)
- National Holiday
- National Day (Anniversary of the Founding of the People's Republic of China), 1 October (1949); note - 1 July 1997 is celebrated as Hong Kong Special Administrative Region Establishment Day
Capital City
- Capital Name
- Victoria
Name of the territory, ceded to Britain by China in 1842, comes from the Chinese hiang kiang, meaning "favorable water" or "good harbor". The capital was named after the British queen.
Military
Branches: No regular indigenous military forces; Hong Kong garrison of China's People's Liberation Army (PLA) includes elements of the PLA Ground Forces, PLA Navy, and PLA Air Force; these forces are under the direct leadership of the Central Military Commission in Beijing and under administrative control of the adjacent Guangzhou Military Region (
Embassy / Diplomatic Mission
U.S. Consulate General Hong Kong & Macau
26 Garden Road, Central, Hong Kong
Telephone: 852-2841-2211 (Direct lines to American Citizen Services during regular business hours)
Emergency after-hours telephone: 852-2523-9011
Facsimile: 852-2845-4845
Read the full government profile — flag symbolism, national anthem, and other national symbols.
View full government detailsEconomy
Economy
Hong Kong has a free market economy highly dependent on international trade and finance, with the value of goods and services trade, including the sizable share of reexports, far exceeding GDP. Natural resources are limited, and food and raw materials must be imported. The territory has deepened its economic integration with mainland China since reverting to Chinese administration on 1 July 1997, and mainland China remains by far its largest trading partner and source of inbound investment. Hong Kong serves as a major global financial center, a leading offshore renminbi hub, and a key gateway for capital flows in and out of the mainland.
Per capita GDP is among the highest in the world, comparable to that of leading Western European economies. Growth has been uneven in recent years. The economy contracted sharply in 2019 amid large-scale social unrest and again in 2020 due to the COVID-19 pandemic, before rebounding in 2021. It slipped back into recession in 2022 as strict pandemic-related restrictions, weaker external demand, and rising global interest rates weighed on activity. Following the lifting of border controls with the mainland and the rest of the world in early 2023, the economy returned to growth, supported by a recovery in tourism, private consumption, and inbound visitor spending, though the property sector and exports of goods have remained under pressure.
Longer-term challenges include an aging population, high housing costs, competition from other regional financial centers such as Singapore and Shanghai, slower mainland growth, and concerns over the territory's business environment following the implementation of the National Security Law in 2020 and additional security legislation in 2024. The government continues to promote Hong Kong's role within the Guangdong–Hong Kong–Macao Greater Bay Area and to develop innovation, technology, and green finance as new pillars of growth.
Snapshot
- Currency Name and Code
- Hong Kong Dollar (HKD)
- GDP — official exchange rate
- $172,600,000,000 (USD)
- GDP Real Growth Rate
- 7.3%
- Gini Index
- 43.4
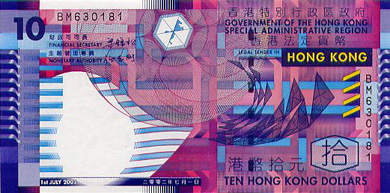
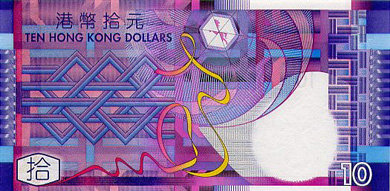
Banknotes
Budget & Public Finance
- Fiscal Year
- 1 April - 31 March
- Annual Budget
- $32,300,000,000 (USD)
- Public Debt (% of GDP)
- 1.8%
- External Debt
- $416,500,000,000 (USD)
- Investment (% of GDP)
- 21.2%
- Current Account Balance
- $23,850,000,000 (USD)
- Reserves of Foreign Exchange
- $2,147,483,647 (USD)
Labor, Industry & Trade
- Labor Force by Occupation
- wholesale and retail trade; restaurants; and hotels 43.5%; financing; insurance; and real estate 19.5%; community and social services 17.8%; manufacturing 8.2%; transport and communications 7.8%; construction 2.9% (Note: above data exclude public sector)
- Industries
- textiles, clothing, tourism, banking, shipping, electronics, plastics, toys, watches, clocks
- Agriculture Products
- fresh vegetables, poultry, fish, pork
- Export Commodities
- electrical machinery and appliances, textiles, apparel, footwear, watches and clocks, toys, plastics, precious stones
- Export Partners
- China 39.3%, US 21.4%, Japan 5.4%
- Import Commodities
- electrical machinery and appliances, textiles, foodstuffs, transport equipment, raw materials, semimanufactures, petroleum, plastics; a large share is reexported
- Import Partners
- China 44.2%, Japan 11.3%, Taiwan 7.2%, US 5.7%, South Korea 4.7%, Singapore 4.7%
Energy
- Oil Production
- 0 bbl/day
- Oil Consumption
- 293,000 bbl/day
- Oil Reserves
- 0 bbl/day
- Natural Gas Production
- 0 cu m
- Natural Gas Consumption
- 692,200,000 cu m
- Natural Gas Imports
- 71,150,000 cu m
- Natural Gas Exports
- 0 cu m
- Natural Gas Reserves
- 0 cu m
Communications
- Telephone System
- General assessment: Modern facilities provide excellent domestic and international services Domestic: Microwave radio relay links and extensive fiber-optic network International: Country code - 852; multiple international submarine cables provide connections to Asia, US, Australia, the Middle East, and Western Europe; satellite earth stations - 3 Intelsat (1 Pacific Ocean and 2 Indian Ocean); coaxial cable to Guangzhou, China
- Internet Country Code
- .hk
News & Weather
News & Weather
Current Weather
Latest News
British woman who reported rape in Hong Kong gets 6 years jail for blackmail, perverting justice - Hong Kong Free Press HKFP
Hong Kong Free Press HKFP · 3h ago
China's Zhongji Innolight sees shares surge after Hong Kong listing approval - CNBC
CNBC · 2d ago
China's Zhongji Innolight plans $8 billion Hong Kong IPO, sources say - Reuters
Reuters · 1d ago
Innolight Seeks Up to $7 Billion in Biggest Hong Kong Listing in Years - Bloomberg.com
Bloomberg.com · 8h ago
Hong Kong High Court judge Wilson Chan to be reprimanded again for plagiarism - South China Morning Post
South China Morning Post · 1h ago
U.S. biotech CEO explains why he chose Hong Kong for primary listing - CNBC
CNBC · 3h ago
Cathay Pacific expects first-half profit to jump 75% to HK$6.5 billion - South China Morning Post
South China Morning Post · 2h ago
‘Litany of failures’ behind Hong Kong’s worst tragedy in decades - Financial Times
Financial Times · 5h ago
News via Google News
Climate Overview
The area's varied climate is governed by the monsoons. Although Hong Kong lies within the Tropics, it enjoys a variety of weather because of these seasonal winds. The winter monsoon blows from the north or northeast from September to mid-March, and the summer wind blows from the south or southwest from mid-March to September. During the summer monsoon, the weather is hot and humid; during the winter monsoon it is cool. Average temperatures range from 58°F in February (with lows in the 40's) to 82°F in July (with highs in the 90's.) The mean relative humidity ranges from a low of 67% in November to 84% in May; many days the humidity approaches 100%, accompanied by heavy clouds. Late fall is the most pleasant time of year, generally with dry and sunny weather and high temperatures of 70° to 75°F. The average annual rainfall is 95 inches.
Videos
Videos
2 curated YouTube videos.
Source: YouTube
Source: YouTube
Frequently Asked Questions
Frequently Asked Questions
What is the population of Hong Kong?
How do people greet each other in Hong Kong?
What are the dining customs in Hong Kong?
What etiquette should I know when visiting a home in Hong Kong?
How should I dress in Hong Kong?
Which gestures are important in Hong Kong?
What is family life like in Hong Kong?
What do people do for recreation in Hong Kong?
What is the capital of Hong Kong?
Where is Hong Kong located?
What religion is practiced in Hong Kong?
What is the currency of Hong Kong?
What languages are spoken in Hong Kong?
What is Hong Kong known for?
What is the geography of Hong Kong like?
Who governs Hong Kong and what is its political status?
Last reviewed 2026